Project Nebula
Real-Time Financial Dashboard for a FinTech Innovator
Overview
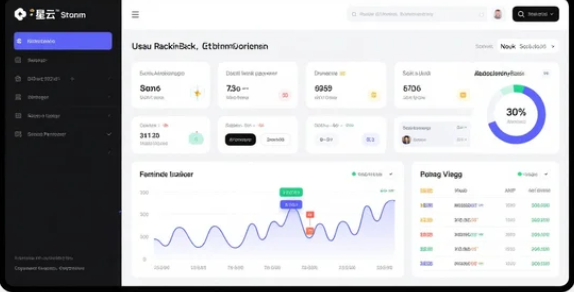
A cutting-edge FinTech startup needed a central hub to visualize complex market data and portfolio performance in real-time. The challenge was to present vast amounts of data in an intuitive, actionable, and visually compelling way for their investment analysts.
Challenge
The client's existing system was fragmented, slow, and lacked interactive features. Analysts spent excessive time compiling reports from multiple sources, hindering quick decision-making. They required a unified, fast, and customizable dashboard.
Our Solution
We developed "Nebula," a single-page application (SPA) built with React.js and D3.js for dynamic charting. The backend was powered by Node.js and Socket.io to deliver real-time data streams. We implemented a modular widget system, allowing each analyst to personalize their dashboard view with relevant KPIs, charts, and news feeds.
- Interactive Visualizations: Drag-and-drop charts with zoom, filter, and drill-down capabilities.
- Real-Time Updates: Live tickers and alerts for critical market movements.
- Responsive Design: Fully functional on tablets for on-the-go analysis.
- Secure API Integration: Connected to multiple financial data providers with robust authentication.
Client
Stellar FinTech Solutions (Confidential)
Industry
Financial Technology
Technologies
React, D3.js, Node.js, Express, Socket.io, MongoDB
Timeline
4 Months
Results
The Nebula dashboard reduced the time analysts spent on data aggregation by 70%. The intuitive interface led to a 40% increase Back to All Portfolio